The 5 Most Important Chart Patterns Every Beginner Should Know
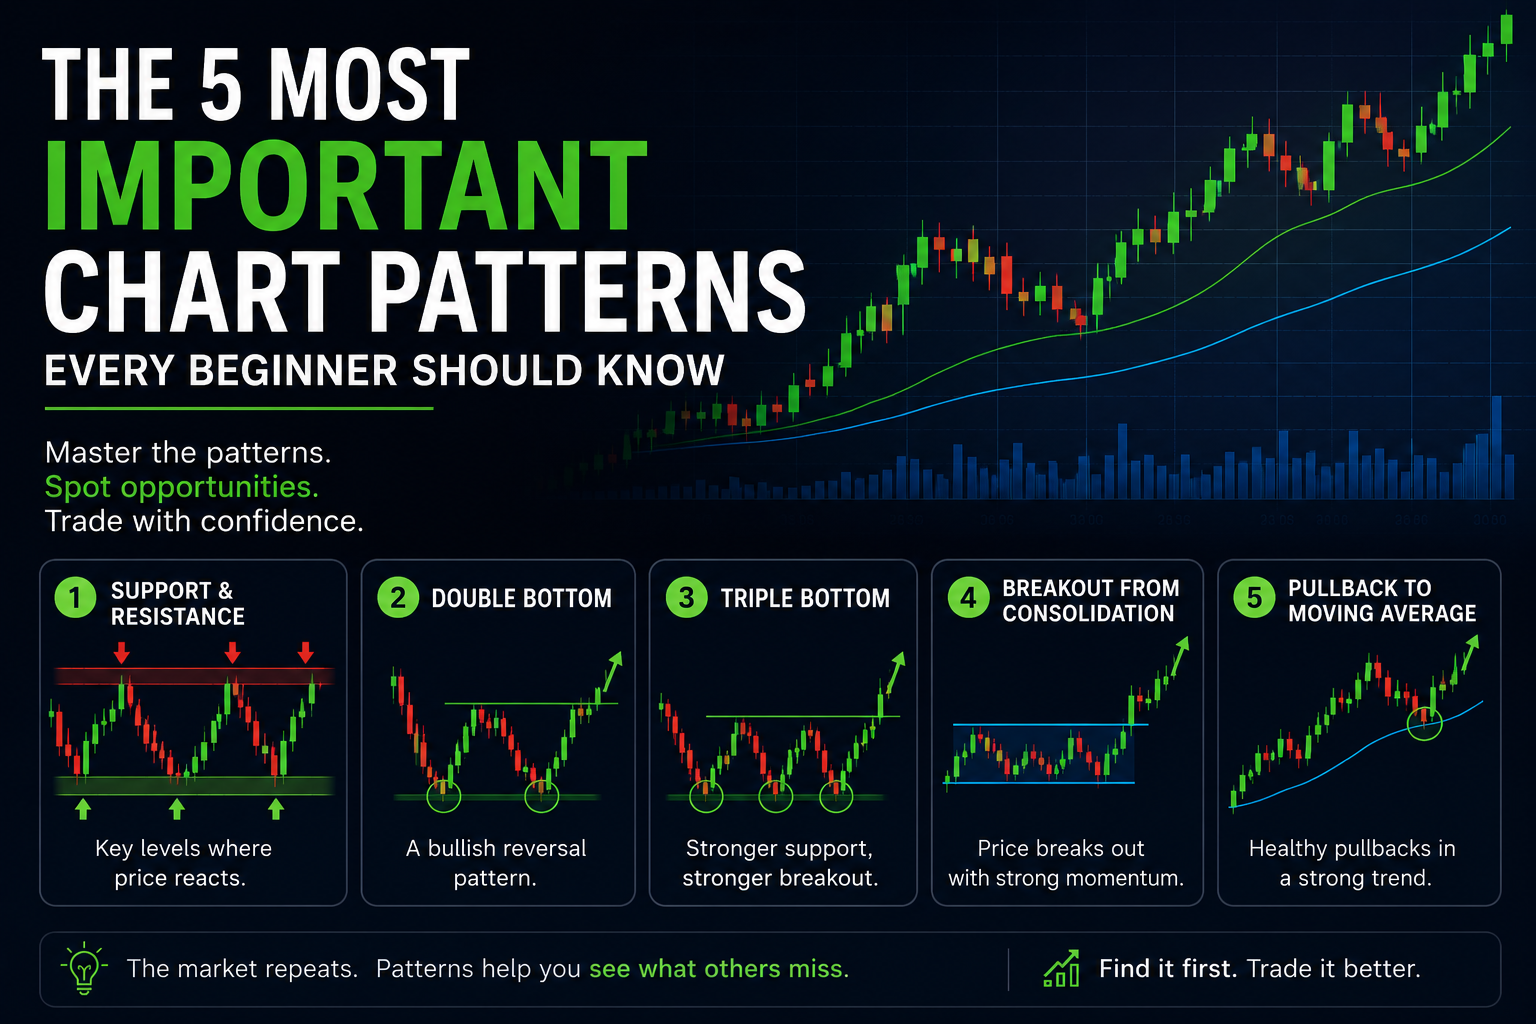
Most beginner traders make the same mistake:
They think successful trading is about predicting the future.
In reality, experienced traders focus on something much simpler: recognizing recurring market behavior.
Stock charts are full of repeated patterns created by fear, greed, hesitation, panic, and momentum.
These patterns appear because human psychology never really changes.
The goal is identifying situations where probabilities may become favorable.
1. Support and Resistance
This is the foundation of technical analysis.
A support level is an area where buyers repeatedly enter the market and stop price from falling further.
A resistance level is an area where sellers repeatedly appear and prevent price from moving higher.
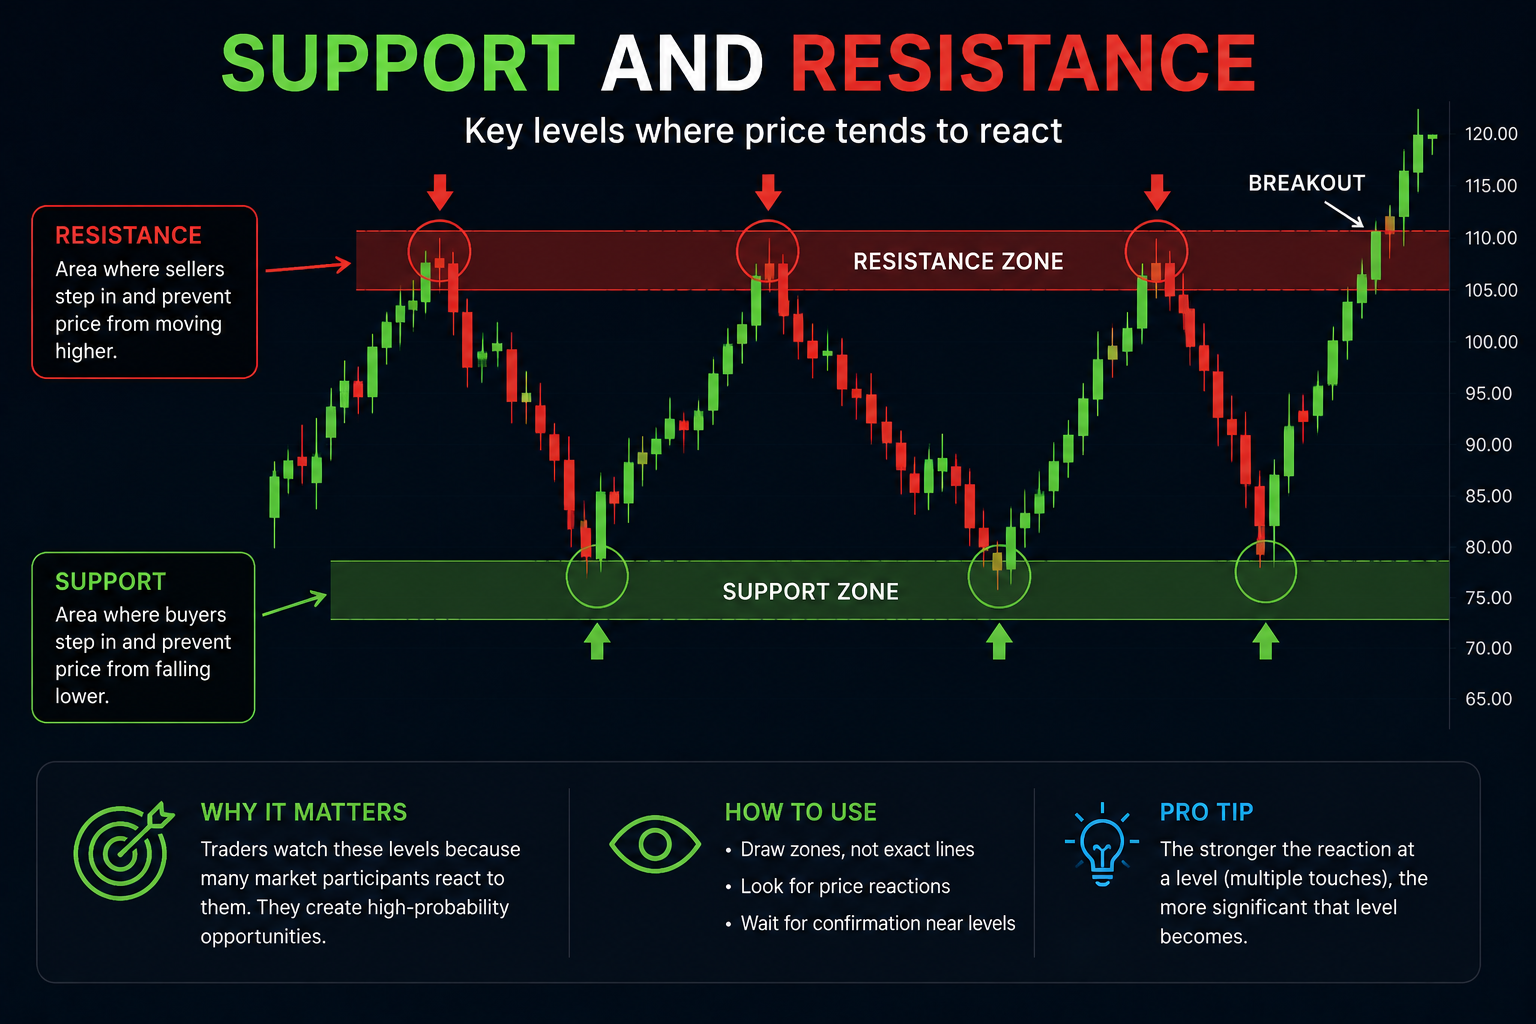
Why It Works
Support and resistance work because markets have memory.
Thousands of traders watch the same levels and react similarly.
Common Beginner Mistake
Many beginners treat support and resistance as exact lines instead of zones.
2. The Double Bottom
The double bottom is one of the most recognizable bullish reversal patterns.
It happens when price falls, rebounds, and then returns to roughly the same low before bouncing again.
Visually, it resembles the letter “W”.
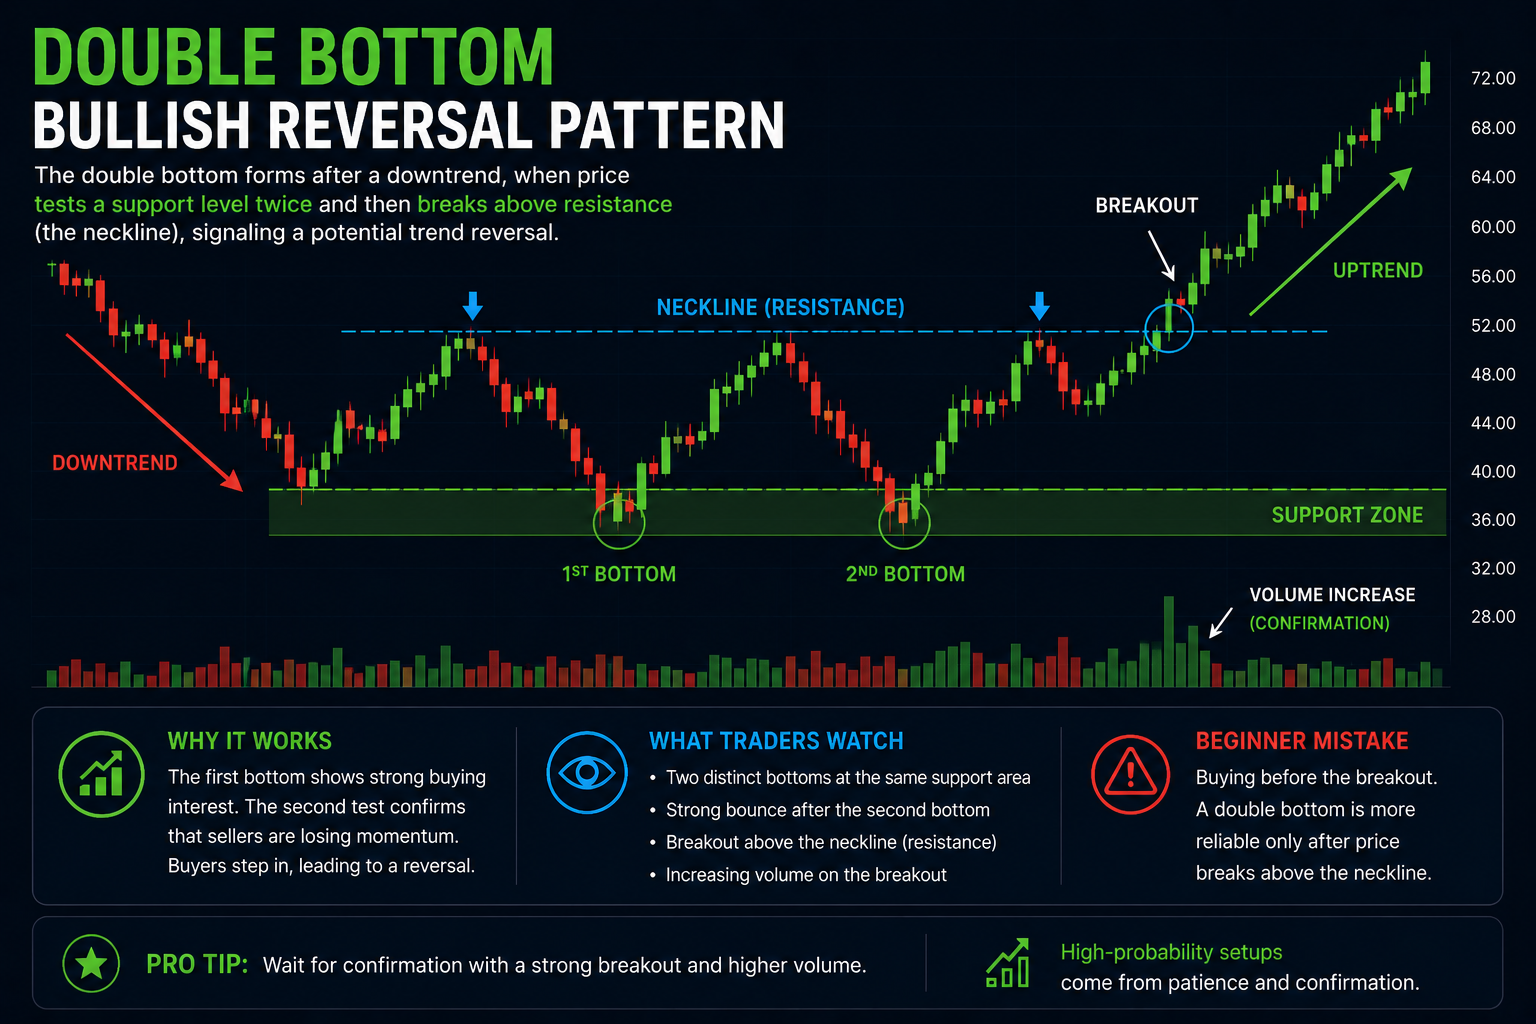
Why It Works
The first drop creates fear.
The second test shows that sellers are losing strength while buyers begin stepping in more aggressively.
What Traders Watch
- Strong bounce after the second low
- Increasing volume
- Breakout above resistance
3. The Triple Bottom
The triple bottom is similar to the double bottom but often considered even stronger.
Price tests the same support area three separate times before breaking upward.
Why It Works
Each failed attempt to break lower weakens bearish momentum.
Eventually sellers become exhausted while buyers gain confidence.
4. Breakout from Consolidation
This is one of the most important patterns used by momentum traders.
A consolidation happens when price moves sideways within a tight range.
Volatility decreases and energy begins building.
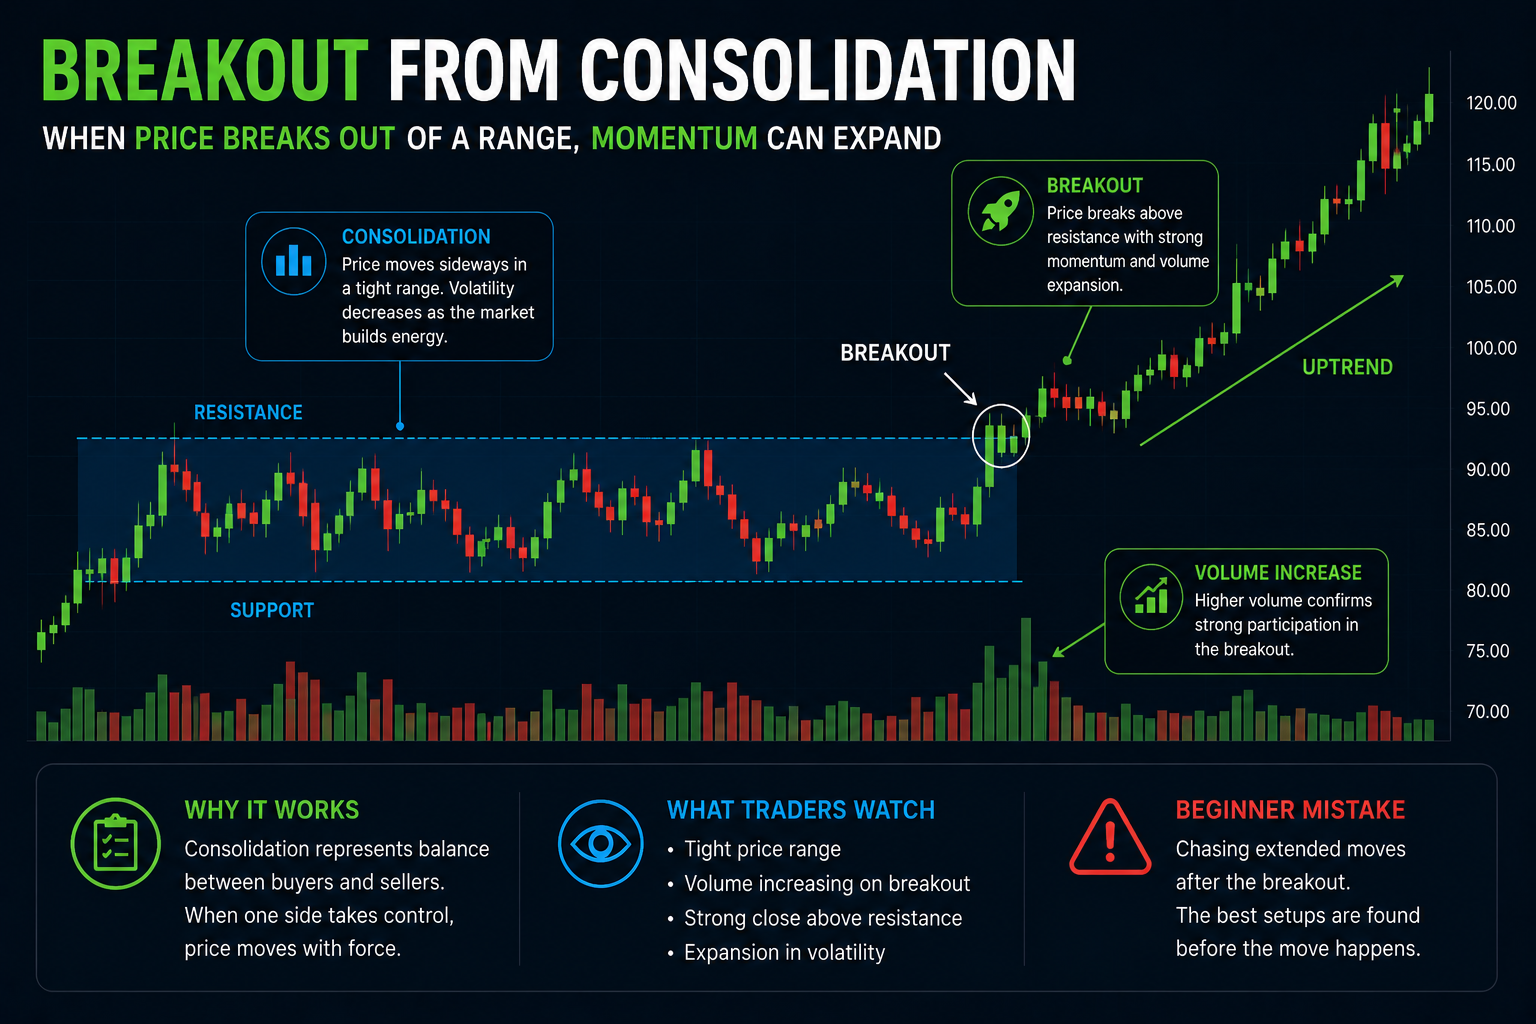
Signs of a Strong Breakout
- Tight price structure
- Increasing relative volume
- Strong close near highs
- Expansion in volatility
5. Pullback to a Moving Average
Strong trends rarely move upward in straight lines.
Instead, price often pulls back temporarily toward important moving averages before continuing higher.
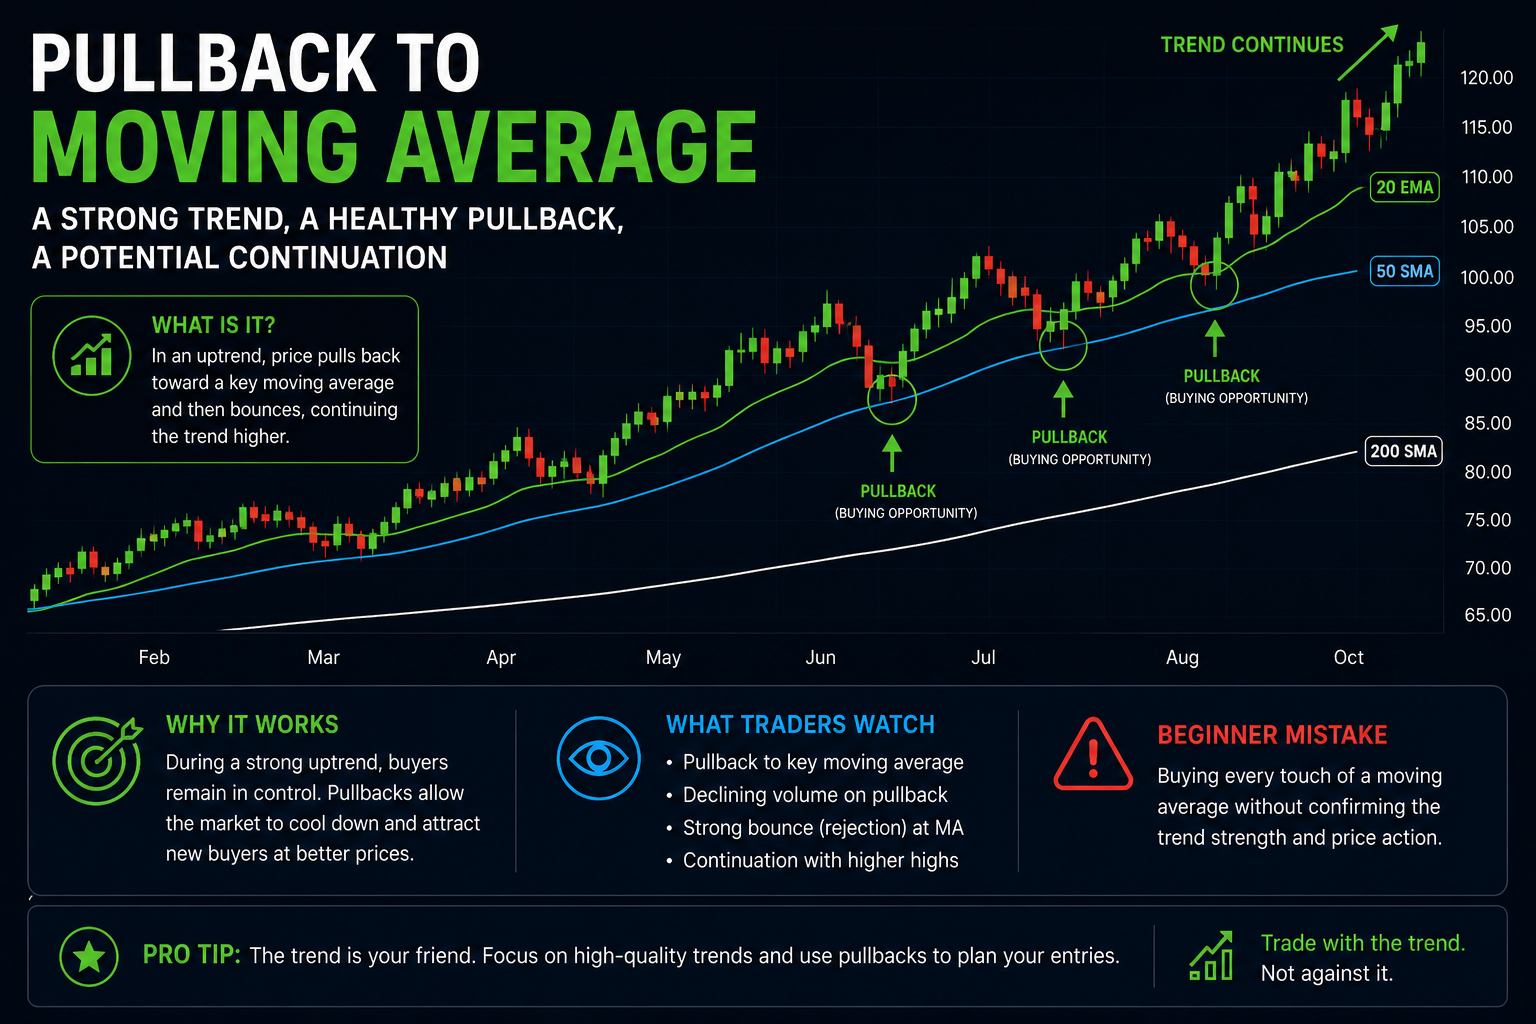
The Most Watched Moving Averages
- 20 EMA
- 50 SMA
- 200 SMA
Why It Works
Millions of traders and institutions monitor the same moving averages.
This creates natural areas where buyers often become active again.
Patterns Are About Probabilities
One of the biggest misconceptions in trading is believing that patterns predict the future.
They do not.
Patterns simply help traders identify situations where probabilities may become favorable.
A good setup does not guarantee success.
It only improves the odds.
The Real Challenge: Finding These Patterns Early
The market contains thousands of stocks.
Every single day, some stocks:
- Build accumulation structures
- Break important resistance levels
- Bounce from moving averages
- Show unusual volume activity
- Form bullish reversal patterns
No human trader can manually analyze everything efficiently.
This is why serious traders use stock scanners.
Instead of randomly searching charts, traders can focus only on the most interesting setups.
Final Thoughts
Technical patterns are not magic.
They are visual representations of repeated human behavior.
The goal is not predicting every move perfectly.
The goal is recognizing high-probability situations faster and more efficiently than the average trader.
In the next article, we’ll explore why moving averages are more important than most beginners think — and how professional traders use them to identify trends and pullbacks.